Home » Applications » VFD versus Control Valve for pump flow controls
VFD versus Control Valve for pump flow controls
It's commonly to control a centrifugal pump with a VFD (variable frequency drive) rather than couple a constant speed pump with a control valve on the discharge. However, many engineers don't understand variable frequency drives impact on flow and how that affects control.
A pump/control-valve combination provides smooth flow even at very small valve openings, although in some cases protection against low flow is required. However, with VFD-driven pumping, flow isn't always smooth at reduced speeds due to either the pump or the VFD.
Here, we'll focus on the pump — specifically, how certain aspects of the pump performance curves can lead to variations in flow at reduced speeds — because this requires the expertise of people in the process group, not the electrical department. Most electrical departments can provide a good analysis of the VFD but aren't familiar with pump performance curves.
Constant speed pump
Low flow protection for a centrifugal pump with a constant speed drive normally entails recirculation back to either an upstream vessel or to the suction of the pump. A proven approach is to measure the flow through the pump and send the value to a controller that manipulates a control valve in the recirculation line.
The set point for the controller is the minimum required pump flow. Under normal operating conditions, flow should exceed this level; so the controller will close the valve in the recirculation line. However, should flow drop below the minimum, the controller will quickly open the control valve to provide the necessary flow.
A control valve also is required in the line to the process to provide appropriate flow. In some configurations, this flow loop is the inner loop for a level-to-flow cascade, a temperature-to-flow cascade or other cascade arrangement. In some cases, the flow isn't measured; instead the output of the level, temperature or other controller is connected directly to the control valve.
Often some modifications are made to reduce costs. We'll assume a flow controller here, but the points generally apply to all configurations.
Because pressure measurements are less expensive than flow ones, a measurement of either discharge pressure or pump differential pressure is substituted for the pump flow measurement. The success of this approach depends on the nature of the pump performance curves; it only works if the pressures significantly change with pump flow.
The control valve can be avoided by inserting a fixed orifice into the recirculation piping. This provides some recirculation at all times, even when the process flow exceeds the minimum necessary for low flow protection. It requires extra energy and, possibly, a larger pump.
VFD-driven pumping
In contrast, with a variable frequency drive a flow measurement is used to adjust a speed or torque controller included with the VFD electronics.
Manufacturers always stress possible energy savings with a variable frequency drive. However, especially in industries such as specialty chemicals, few VFDs are large enough to provide sufficient energy savings to justify their additional cost.
However, a variable frequency drive offers other potential benefits. It may make the following equipment unnecessary:
The controller for pump flow also is eliminated but this component is likely to be in the software of the digital controls and therefore "free."
The above only considers normal process operations. The minimum flow for the variable frequency drive will be lower than that for the constant speed VFD but won't be zero. There are always startup issues to be addressed and usually other considerations. For example, it may be important to prevent fluid backflows through the pump. If positive shutoff is required, the control valve in the line to the process must be replaced by a block valve.
Nevertheless, eliminating even a single item of equipment, particularly one that would be made of stainless steel or other expensive material, may easily offset the additional variable frequency drive cost. And these savings come upfront, which appeals to project managers.
A variable frequency drive also can provide maintenance savings. Control valves are high upkeep items, and handling corrosive and toxic fluids makes matters worse. Just replacing a control valve with a block valve reduces maintenance costs.
From a control perspective, a variable frequency drive has another distinct advantage — it doesn't exhibit stiction, hysteresis and other mechanical issues posed by a control valve. Today's VFDs incorporate either speed control or torque control, thus providing the counterpart to the positioner advocated by control engineers for control valves.
Flow regulation with a control valve
The flow through a pump is determined by the following curves:
Suppose friction head is known for a specific flow. (This data point should be available from design calculations.) Assuming friction head varies with the square of the flow, the system curve can be approximated by:
HP = HS + HD (QP/QD)2 (1)
where QP is process flow, gal/min; HP is head at process flow QP, ft; HS is static head, ft; QD is design flow, gal/min; and HD is friction head at flow QD, ft.
The operating point is always where the pump curve intersects the system curve.
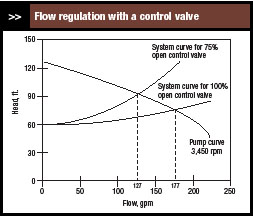
Control valves regulate flow by varying friction head — that is, they work entirely through the system curve, as illustrated in Figure 1. It presents system curves for a fully open control valve and a control valve that is 75% open. For the fully open valve, flow is 177 gal/min. As the control valve closes, resistance to flow increases. This raises the friction head component of the system curve, which makes that curve intersect the pump curve at a lower flow — at 75% open, flow is 127 gal/min.
Small variations in both static and friction head occur in any pumping installation. These head variations cause flow variations, which also can be determined from the performance curves.
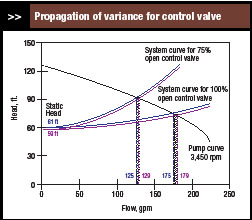
Suppose the static head is 60 ±1 ft. Figure 2 shows system curves for 59 ft. and 61 ft. and where they intersect with the pump curve. For the fully open control valve, flow is 177 ±2 gal/min; for the 75% open control valve, flow is 127 ±2 gal/min. In each case, a head variance of ±1 ft. leads to a flow variance of ±2 gal/min.
Closing the control valve doesn't significantly affect the propagation of variance from head to flow. But as we shall see, this isn't necessarily the case for VFD controlled pumps.
Flow regulation with a variable frequency drive
With VFD-driven pumping, the system curve is fixed but the pump curve shifts with pump speed. Some manufacturers provide pump curves for certain selected speeds; others provide a pump curve only for the rated speed of a constant speed VFD. In either case, the affinity laws can be applied to obtain pump curves at other speeds:
Q(N) = QC (N/NC) (2)
H(N) = HC (N/NC)2 (3)
where N is speed, rpm; NC is speed for the pump curve supplied by the manufacturer, rpm; Q(N) is volumetric flow at speed N, gal/min; QC is volumetric flow at speed NC (from the pump curve), gal/min; H(N) is head at speed N, ft.; and HC is head at speed NC (from the pump curve), ft.
Flow decreases in proportion to the pump speed; head decreases in proportion to the square of the pump speed. The affinity laws also state that power decreases with the cube of the pump speed, which strengthens the energy savings arguments by variable frequency drive manufacturers.
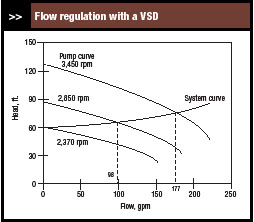
Figure 3 illustrates regulating flow by varying pump speed. The system curve is fixed. For a pump speed of 3,450 rpm, the flow through the pump is 177 gal/min; for 2,850 rpm, 98 gal/min; and for 2,370 rpm, 0 gal/min. In fact, 2,370 rpm is the minimum pump speed for flow — that is, flow occurs only for speeds above 2,370 rpm.
The minimum speed to obtain flow is easily computed. When there's no flow, the system head is the static head. The pump curve shows the head delivered by a pump with no flow and running at speed NC. The minimum pump speed to obtain flow is computed using the affinity laws:
Nmin = NC (HS/HC0)½ (4)
where Nmin is minimum pump speed for flow, rpm; HS is static head (from the system curve); and HC0 is head at speed NC and zero flow (from the pump curve), ft.
For our example, NC is 3,450 rpm, HS is 60 ft., and HC0 is 127 ft. The minimum pump speed is 2,370 rpm. So, the variable frequency drive must operate over the range of 2,370 rpm to 3,450 rpm. The minimum speed is 69% of the maximum speed; the turndown ratio is 1.46:1. variable frequency drives are easily capable of this.
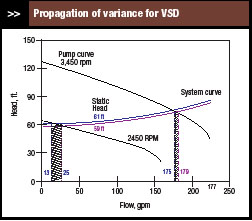
Figure 4 illustrates propagation of variance from static head to flow for pump speeds of 3,450 rpm and 2,450 rpm. At 3,450 rpm, a static head of 60 ±1 ft. gives a flow of 127 ±2 gal/min (just like for the fully open control valve). However, at 2,450 rpm, a static head of 60 ±1 ft. gives a flow of 19 ±6 gal/min. As the pump speed decreases, the variance in flow increases by a factor of three.
Even with this increase in variance, the pump probably would still perform satisfactorily. At low flows, the pump curve in Figure 4 exhibits a significant sensitivity of head to flow. This isn't the case for all pumps. For some, the pump curve at low flows is essentially flat (slope is zero) — that is, at low flows, pump head is independent of flow. For such pump curves, the propagation of variance from static head to pump flow would be much larger.
Pumps with a flat pump curve at low flows likely will experience cycling between no flow and some positive flow. Avoid them if you want a variable frequency drive to perform smoothly at low flows. Pumps with pump curves such as in Figure 6 probably wouldn't exhibit the cycling.
Sensitivity of flow to pump speed
It's also important to understand the change in flow produced by a given change in pump speed.
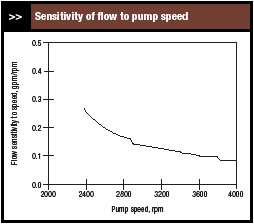
Figure 5 presents the sensitivity of flow to pump speed for the range of speeds over which the pump could operate. (The somewhat erratic nature of the graph is the result of digitizing the pump curve.) It shows that the sensitivity increases as the pump speed decreases — that is, at low pump speeds, a change in speed has a larger effect on flow than the same change at high speeds.
Such a change in sensitivity affects the performance of the control loop (flow, level, temperature or other) whose output determines the pump speed. As the sensitivity increases, more oscillations can be expected in that loop. So, to use the same tuning at low flows and at high flows, either tune the loop under a low flow condition or conservatively tune the loop at high flows. The results are essentially the same — the controller is tuned with a lower gain. For the controller to function at low flows, performance is sacrificed at high flows.
While techniques such as scheduled tuning could address this problem, conservative tuning usually can accommodate a change in sensitivity of 3:1. But it's possible that the change in sensitivity could far exceed 3:1. At low flows, the pump curve in our example exhibits a significant sensitivity of head to flow. However, the pump curve for some pumps is basically flat. For such pumps, the increase in sensitivity would be much larger than 3:1 and could even lead to instabilities in the loop that outputs to the pump speed.
Torque
Pump curves traditionally are drawn with pump speed as a parameter. This might imply that the flow through the pump is best controlled by varying the pump speed, but it isn't necessarily the case. Changing the torque may make more sense. variable frequency drives can control either of these variables.
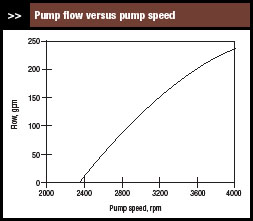
When the input signal to the VFD electronics adjusts pump speed, the relationship between flow through the pump and pump speed is important. This can be computed from the pump curve and system curve (Figure 6). The departure from linearity is noticeable — and is consistent with the changes in the sensitivity of flow to speed (Figure 5).
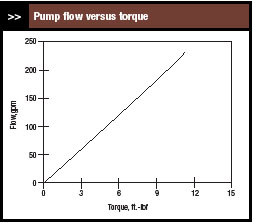
When the input signal to the VFD electronics adjusts torque, the relationship between flow through the pump and torque is important. This also can be computed from the pump curve and system curve (Figure 7). The graph exhibits only a slight departure from linearity, making it preferable for PID control as that control equation is linear.
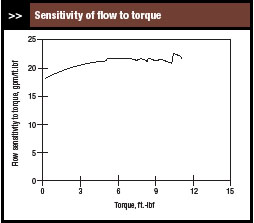
Figure 8 presents the sensitivity of flow to torque for the range over which the pump could operate. The somewhat erratic nature of the graph is the result of digitizing the pump curve. The sensitivity changes only slightly over the operating range.
These graphs were computed from the pump curve (Figure 5), which exhibits significant sensitivity of head to flow at low pump flows. As already mentioned, for some pumps the pump curve is flat at low flows — that is, the head is almost constant at such flows.
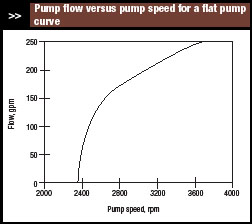
Figure 9 shows flow as a function of speed for a pump with a flat pump curve. The departure from linearity is much greater. At low flows this graph is almost vertical, so the sensitivity of flow to speed at low flows will be very large, which could lead to cycling in the flow.
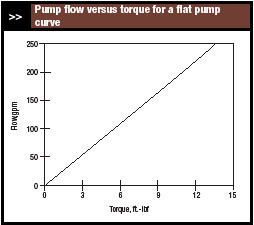
However, even for a pump with a flat pump curve, the relationship between flow and torque is nearly linear (Figure 10). Generally linear behavior leads to better performance from the controls.
So, for a centrifugal pump with a variable frequency drive it's usually preferable to use torque to control flow. This also seems consistent with the future directions for variable frequency drive technology.
A pump/control-valve combination provides smooth flow even at very small valve openings, although in some cases protection against low flow is required. However, with VFD-driven pumping, flow isn't always smooth at reduced speeds due to either the pump or the VFD.
|
| Figure 1. As the valve closes, friction head increases, leading to lower flow. |
Here, we'll focus on the pump — specifically, how certain aspects of the pump performance curves can lead to variations in flow at reduced speeds — because this requires the expertise of people in the process group, not the electrical department. Most electrical departments can provide a good analysis of the VFD but aren't familiar with pump performance curves.
Constant speed pump
Low flow protection for a centrifugal pump with a constant speed drive normally entails recirculation back to either an upstream vessel or to the suction of the pump. A proven approach is to measure the flow through the pump and send the value to a controller that manipulates a control valve in the recirculation line.
The set point for the controller is the minimum required pump flow. Under normal operating conditions, flow should exceed this level; so the controller will close the valve in the recirculation line. However, should flow drop below the minimum, the controller will quickly open the control valve to provide the necessary flow.
|
| Figure 2. The variance in head leads to twice as much variance in flow. |
A control valve also is required in the line to the process to provide appropriate flow. In some configurations, this flow loop is the inner loop for a level-to-flow cascade, a temperature-to-flow cascade or other cascade arrangement. In some cases, the flow isn't measured; instead the output of the level, temperature or other controller is connected directly to the control valve.
Often some modifications are made to reduce costs. We'll assume a flow controller here, but the points generally apply to all configurations.
Because pressure measurements are less expensive than flow ones, a measurement of either discharge pressure or pump differential pressure is substituted for the pump flow measurement. The success of this approach depends on the nature of the pump performance curves; it only works if the pressures significantly change with pump flow.
The control valve can be avoided by inserting a fixed orifice into the recirculation piping. This provides some recirculation at all times, even when the process flow exceeds the minimum necessary for low flow protection. It requires extra energy and, possibly, a larger pump.
VFD-driven pumping
|
| Figure 3. Only pump speeds greater than 2,370 rpm provide flow. |
Manufacturers always stress possible energy savings with a variable frequency drive. However, especially in industries such as specialty chemicals, few VFDs are large enough to provide sufficient energy savings to justify their additional cost.
However, a variable frequency drive offers other potential benefits. It may make the following equipment unnecessary:
- sensor/transmitter for pump flow
- recirculation piping
- control valve in the recirculation piping
- control valve in the line to the process
The controller for pump flow also is eliminated but this component is likely to be in the software of the digital controls and therefore "free."
|
| Figure 4. The variance in head causes triple the variation in flow. |
The above only considers normal process operations. The minimum flow for the variable frequency drive will be lower than that for the constant speed VFD but won't be zero. There are always startup issues to be addressed and usually other considerations. For example, it may be important to prevent fluid backflows through the pump. If positive shutoff is required, the control valve in the line to the process must be replaced by a block valve.
Nevertheless, eliminating even a single item of equipment, particularly one that would be made of stainless steel or other expensive material, may easily offset the additional variable frequency drive cost. And these savings come upfront, which appeals to project managers.
A variable frequency drive also can provide maintenance savings. Control valves are high upkeep items, and handling corrosive and toxic fluids makes matters worse. Just replacing a control valve with a block valve reduces maintenance costs.
From a control perspective, a variable frequency drive has another distinct advantage — it doesn't exhibit stiction, hysteresis and other mechanical issues posed by a control valve. Today's VFDs incorporate either speed control or torque control, thus providing the counterpart to the positioner advocated by control engineers for control valves.
Flow regulation with a control valve
The flow through a pump is determined by the following curves:
- Pump performance curve (or just "pump curve"). This curve, provided by the pump manufacturer, relates pump flow, pump head and pump speed.
-
System performance curve (or just "system curve"). This curve relates the head and flow of all components in the fluid flow path (the flow system) excluding the pump. Two components determine this curve:
- Static head. This is the difference in head across the flow system when flow is zero. It includes pressure head and hydrostatic head. The pump must work against this head even at zero flow.
- Friction head. As flow increases, pressure drop due to the fluid's resistance to flow increases by approximately the square of the flow. All components in the flow system contribute to friction head.
Suppose friction head is known for a specific flow. (This data point should be available from design calculations.) Assuming friction head varies with the square of the flow, the system curve can be approximated by:
HP = HS + HD (QP/QD)2 (1)
|
| Figure 5. As speed increases, the impact of speed changes on flow decreases. |
where QP is process flow, gal/min; HP is head at process flow QP, ft; HS is static head, ft; QD is design flow, gal/min; and HD is friction head at flow QD, ft.
The operating point is always where the pump curve intersects the system curve.
Control valves regulate flow by varying friction head — that is, they work entirely through the system curve, as illustrated in Figure 1. It presents system curves for a fully open control valve and a control valve that is 75% open. For the fully open valve, flow is 177 gal/min. As the control valve closes, resistance to flow increases. This raises the friction head component of the system curve, which makes that curve intersect the pump curve at a lower flow — at 75% open, flow is 127 gal/min.
Small variations in both static and friction head occur in any pumping installation. These head variations cause flow variations, which also can be determined from the performance curves.
Suppose the static head is 60 ±1 ft. Figure 2 shows system curves for 59 ft. and 61 ft. and where they intersect with the pump curve. For the fully open control valve, flow is 177 ±2 gal/min; for the 75% open control valve, flow is 127 ±2 gal/min. In each case, a head variance of ±1 ft. leads to a flow variance of ±2 gal/min.
|
| Figure 6. Nonlinear relationship can hamper using PID control. |
Closing the control valve doesn't significantly affect the propagation of variance from head to flow. But as we shall see, this isn't necessarily the case for VFD controlled pumps.
Flow regulation with a variable frequency drive
With VFD-driven pumping, the system curve is fixed but the pump curve shifts with pump speed. Some manufacturers provide pump curves for certain selected speeds; others provide a pump curve only for the rated speed of a constant speed VFD. In either case, the affinity laws can be applied to obtain pump curves at other speeds:
Q(N) = QC (N/NC) (2)
H(N) = HC (N/NC)2 (3)
where N is speed, rpm; NC is speed for the pump curve supplied by the manufacturer, rpm; Q(N) is volumetric flow at speed N, gal/min; QC is volumetric flow at speed NC (from the pump curve), gal/min; H(N) is head at speed N, ft.; and HC is head at speed NC (from the pump curve), ft.
Flow decreases in proportion to the pump speed; head decreases in proportion to the square of the pump speed. The affinity laws also state that power decreases with the cube of the pump speed, which strengthens the energy savings arguments by variable frequency drive manufacturers.
Figure 3 illustrates regulating flow by varying pump speed. The system curve is fixed. For a pump speed of 3,450 rpm, the flow through the pump is 177 gal/min; for 2,850 rpm, 98 gal/min; and for 2,370 rpm, 0 gal/min. In fact, 2,370 rpm is the minimum pump speed for flow — that is, flow occurs only for speeds above 2,370 rpm.
The minimum speed to obtain flow is easily computed. When there's no flow, the system head is the static head. The pump curve shows the head delivered by a pump with no flow and running at speed NC. The minimum pump speed to obtain flow is computed using the affinity laws:
Nmin = NC (HS/HC0)½ (4)
where Nmin is minimum pump speed for flow, rpm; HS is static head (from the system curve); and HC0 is head at speed NC and zero flow (from the pump curve), ft.
For our example, NC is 3,450 rpm, HS is 60 ft., and HC0 is 127 ft. The minimum pump speed is 2,370 rpm. So, the variable frequency drive must operate over the range of 2,370 rpm to 3,450 rpm. The minimum speed is 69% of the maximum speed; the turndown ratio is 1.46:1. variable frequency drives are easily capable of this.
|
| Figure 7. More linear relationship better matches the PID control equation. |
Figure 4 illustrates propagation of variance from static head to flow for pump speeds of 3,450 rpm and 2,450 rpm. At 3,450 rpm, a static head of 60 ±1 ft. gives a flow of 127 ±2 gal/min (just like for the fully open control valve). However, at 2,450 rpm, a static head of 60 ±1 ft. gives a flow of 19 ±6 gal/min. As the pump speed decreases, the variance in flow increases by a factor of three.
Even with this increase in variance, the pump probably would still perform satisfactorily. At low flows, the pump curve in Figure 4 exhibits a significant sensitivity of head to flow. This isn't the case for all pumps. For some, the pump curve at low flows is essentially flat (slope is zero) — that is, at low flows, pump head is independent of flow. For such pump curves, the propagation of variance from static head to pump flow would be much larger.
Pumps with a flat pump curve at low flows likely will experience cycling between no flow and some positive flow. Avoid them if you want a variable frequency drive to perform smoothly at low flows. Pumps with pump curves such as in Figure 6 probably wouldn't exhibit the cycling.
Sensitivity of flow to pump speed
It's also important to understand the change in flow produced by a given change in pump speed.
|
| Figure 8. Value remains relatively constant over the entire operating range. |
Figure 5 presents the sensitivity of flow to pump speed for the range of speeds over which the pump could operate. (The somewhat erratic nature of the graph is the result of digitizing the pump curve.) It shows that the sensitivity increases as the pump speed decreases — that is, at low pump speeds, a change in speed has a larger effect on flow than the same change at high speeds.
Such a change in sensitivity affects the performance of the control loop (flow, level, temperature or other) whose output determines the pump speed. As the sensitivity increases, more oscillations can be expected in that loop. So, to use the same tuning at low flows and at high flows, either tune the loop under a low flow condition or conservatively tune the loop at high flows. The results are essentially the same — the controller is tuned with a lower gain. For the controller to function at low flows, performance is sacrificed at high flows.
While techniques such as scheduled tuning could address this problem, conservative tuning usually can accommodate a change in sensitivity of 3:1. But it's possible that the change in sensitivity could far exceed 3:1. At low flows, the pump curve in our example exhibits a significant sensitivity of head to flow. However, the pump curve for some pumps is basically flat. For such pumps, the increase in sensitivity would be much larger than 3:1 and could even lead to instabilities in the loop that outputs to the pump speed.
Torque
|
| Figure 9. High sensitivity of flow to speed at low rpm could lead to cycling. |
When the input signal to the VFD electronics adjusts pump speed, the relationship between flow through the pump and pump speed is important. This can be computed from the pump curve and system curve (Figure 6). The departure from linearity is noticeable — and is consistent with the changes in the sensitivity of flow to speed (Figure 5).
When the input signal to the VFD electronics adjusts torque, the relationship between flow through the pump and torque is important. This also can be computed from the pump curve and system curve (Figure 7). The graph exhibits only a slight departure from linearity, making it preferable for PID control as that control equation is linear.
|
| Figure 10. Nearly linear relationship offers advantage for control. |
Figure 8 presents the sensitivity of flow to torque for the range over which the pump could operate. The somewhat erratic nature of the graph is the result of digitizing the pump curve. The sensitivity changes only slightly over the operating range.
These graphs were computed from the pump curve (Figure 5), which exhibits significant sensitivity of head to flow at low pump flows. As already mentioned, for some pumps the pump curve is flat at low flows — that is, the head is almost constant at such flows.
Figure 9 shows flow as a function of speed for a pump with a flat pump curve. The departure from linearity is much greater. At low flows this graph is almost vertical, so the sensitivity of flow to speed at low flows will be very large, which could lead to cycling in the flow.
However, even for a pump with a flat pump curve, the relationship between flow and torque is nearly linear (Figure 10). Generally linear behavior leads to better performance from the controls.
So, for a centrifugal pump with a variable frequency drive it's usually preferable to use torque to control flow. This also seems consistent with the future directions for variable frequency drive technology.
Post a Comment:
You may also like:
Featured Articles
Variable frequency drive application ...
 Variable Frequency Drive (VFD) can be used in lots of fields. Variable frequency drives are widely used to control the speed of ...
 Variable Frequency Drive (VFD) can be used in lots of fields. Variable frequency drives are widely used to control the speed of ...
VFD manufacturers
